
Description
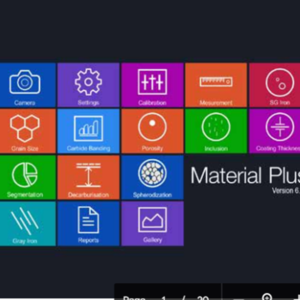
THE IMAGE ANALYSIS SOFTWARE
Grain size measurement (16 detectable phrases)
Inclusion analysis
Modularity analysis
Decarburization analysis, depth and area%
Phrase analysis.
Porosity.
Measurement.
Coating thickness
Linear measurement like plating, coating, decarburization banding,
Inter lamellar distance, dendritic arm Spacing, and defects.
Other features like image data base, maintenance, report generation,
Macro imaging.
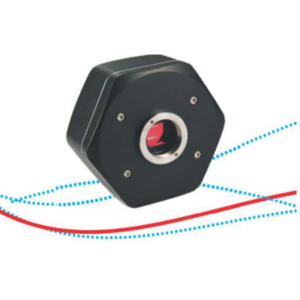
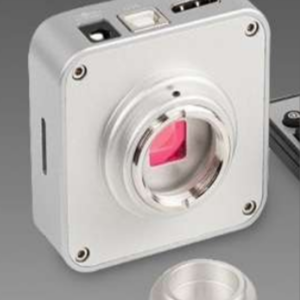
IMAGE GRABBING & PROCESSING HARDWARE:
High resolution image acquisition card with PCI master DMA interface (CCIR, PALNTSC,
RS170, S-VIDEO etc)
Resolution min 768X 576 Pixels at Hz
RGB Color up to 24-bit.
Programmable gain 7 off sets.
Four selectable composite or YC inputs.
Supporting Operating system: DOS, WIN98, and WIN2000/XP.
Capture Speed: 25 Frames per PCS for PAL Systems.
METALLOGRAPHY TOOLS
MODULES CONSISTING OF ASTM E 112, ASTM E 566 1245 ASTM E 1077 ASTM
(A). Grain Size: As per American Standard of Testing Materials (ASTM) Grain Measurement and
Number can be arrived at with direct tabulation method on two methods.
1. Manual and 2. Interception .In manual you can select with mouse. It will measure Intercept,
Diameter, Grain No., Avg, Grain Area (mm) and measure to ASTM E 112 methods. 3. In
Interception method it is automatic. It will measure Mean Intercept, Diameter, Grain No., Avg,
Grain Area in (mm), and Avg. Grain Area in (mm).
(B). Phase:- ASTM E 566 1245
This is used to estimate the area percentage of different phase’s composition of material.
Phase Analysis. Threshold can be done by different colors. Number of Phases can be drawn. Preview
can be seen. It will calculate Area% and Area of selected Phase in different colors. Single Phase can
be done by simply clicking on particular portion and it can be reset or deleted.
It allows user to acquire, process, and analyze the images of the polished sections when it is
necessary to estimate the area percentage of different phases. If the image is color or b/w (depending
in the image) the program starts its processing. The phases for (e.g. different minerals, inclusions in
the metals, etc.) are threshold. For phase threshold the B/W or Color manual threshold method is
used. If you are not satisfied with their threshold there is an ability to adjust it by moving the
graphical sliders.
(C). Decarbization: – ASTM E 1077
This is used for Decarbization. It has two methods Manual and Automatic. In manual method
you can simply mark two different portions then it will calculate the decarb level in automatic you
have to simply move the slider and click on Decrab it will calculate Max, Min and Average of
decrab level
(E). Coating Thickness: – ASTM B 487
It has two options manually and Automatic. In manually simply marks your Area for
calculating then it will calculate. In Automatic simply mark your portion with the mouse it will be
appeared in rectangular shape then click on calculate. It will give results in Min Length, Max length,
Average length, Min height Max height and Average height.
(F). Modularity: – ASTM A 247
This is used for Nodules analysis. It has three intensity ranges for counting Manual by
selecting area, Automatic dark objects, and Automatic bright objects. It will count in Total Count,
Max Dia, Min Dia, Max Area, Min Area, and Percentage. It will give Results in Total Objects,
Nodule count, Modularity %, Nodules /mm sq, Max Dia, Min Dia, Max Area, and Min Area.
(G). Porosity: ASTM 276
This is used for Porosity Analysis. It has three intensity ranges for counting Manual by
selecting area, Automatic dark objects, and Automatic bright objects. It will count in Total Count,
Max Dia. Min Dia, Max Area, Min Area, and Percentage. It can be measured on selected Phase also
by simple clicking on your sample images. It will give Results in Field Name, No. of count, Area %,
Dia Average, Area Average.
H) Inclusion: ASTM 454- E 1245
Non-Metallic Inclusion rating can be done by ASTM & DIN standards. It will give in Min,
Max, Length, Width, Ap. Ratio., Type, Severity level. It will give results for Type in A THIN, A
THICK, B THIN, B THICK, C THIN, C THICK, D THIN, D THICK. For Severity level it starts
from .5, 1, 1.5,2, and 2.5 to 5. Results in %.
(I). Particle Measurement:
This is used for measuring particles by simple clicking on it. It has three intensity range for
counting, Manual by selecting area, Automatic dark objects, Automatic bright objects. Labels in
numbers, Color of label can be changed. It will give results in Sr. No, Length, Width, Area and Ap.
Ratio.
(J). Density:
This is used for measuring density in Black & White images. It will give results in %. It can be
done by simply dragging the mouse on the image as rectangular shape.
(K). Filters:
It has various filters for improving image quality. It has Solarize, Emboss, Bright, Sharpness,
and Smooth, Diffuse, and Contrast. It can be done simply moving slider.
(L). Invert:
Image can be changed in Invert and can be saved with new name.
(M). Annotation:
It has various options like you can write text on image, we can mark with arrow, we can
mark with pointer, and we can draw square and rectangle on image. We can change Line color, text
color, Font color, size, Font name, Bold, Italic, and Underline. These all can be saved with new file
name. It can be refreshing if you have made any mistake.
(N). Back Ground Removal:
It is used for removing background color that is used in Phase Analysis. It is used when an
image is not cleared.
(O). Amalgamation:
This is for merging two images.
Features of Main Menu
(A). Save & Save As:
This is used for images with different names.
(B). Report Preview:
This is used for giving details report like Name, Evaluation Date, Sample ID No.,
Application, Operator, and Microscope Objective. After filling details, You can see reports in MS-
Word and MS-Excel formats ,It will generate reports with image, data, various other related
information and all details results, and also with Histogram with different colors. Reports can be
generated with the company’s logos and its name and address. Now you can see report in Excel with
two images Original Image and Effective Image. Now reports are in best format.
(C). Zoom:
Image can be enlarged.
.
(D). Inclusion DIN:
This is used for measuring Inclusion Rating as Per Din standards (50602). It will show Graph,
Min & Max, Length, Width, Aspect ratio, Polished Area in Six No., and with SS, OA, OS, and OG.
(E). DIN PER:
This tool is used for Analysis of Ferrite, Pearlite, Graphite, Carbide and more. We will get
result in Min Value, Max Value, and Area%.
(G). Gallery:
In these features you can make album of your captured images for further use. You can add
new images into gallery, Delete old one, you can see with zoom view and you can see the details of
the images.
(I). Delete Calibration:-
We can also delete unwanted calibration from combo box.
(A). Open Image:
Now we can open image in. bmp and .jpeg, format.
(B). Open Image & Convert:-
Now we can open image in .tff, .pcx, .rle, and .awd then Convert it into .bmp and .jpeg then
use for analysis.
(C). Show Capture:
We can directly capture images through the software without going outside the software. It
has various features. You have to install only frame grabber card driver we can easily capture images
into the computer. We can capture images in .bmp format. It has more features like:
I. Close Capture
II. Load Palette
III. Set Capture File As * .avi etc.
IV. Allocate File Space
V. Save Captured Video As
VI. Save Palette
VII. Save single Frame As. Bmp
(D).Image
1. Modify or Comparison:
We can call it Cut-Copy and Paste. We can simply drag the image from the list box In this
features we can copy, cut, paste, a particular portion of image later on we can paste it on the image
and can be moved any where on the image. It can be fixed on the image. Further the modified image
can be saved with new file name. It has feature like Undo, Redo, Clear, Update layers. We can add
comments on the images with different colors. We can move our comments also by simple clicking
mouse on particular portion.
2. Gray Scale:
We can change image into gray scale by simple click.
3. Resize Picture:
We can increase image size from 100% to 800% assume value in 1 to 8 . We can decrease images
size from 100% to 10% assume value in 1to 10.
(E). Options
It has various options for capturing cards.
I. Audio Format II. Format
III Source IV. Display
V. Compression VII. Preview
VIII Overlay IX. Card Details
(F). Capture
This option is also for capturing.
I. Single Frame II. Frames
III. Video IV. Pallete
Reviews
There are no reviews yet.